
What is a BCG Growth-Share Matrix?
It is a portfolio planning method, first developed by the Boston consulting group (founded by Bruce Henderson), that evaluates a company’s strategic business units in terms of market growth and relative market share. It allows companies to see how market share can be expanded in certain markets, while others are reduced. The BCG growth-share matrix is one of the few analytical tools that has been shown to be predictive and useful for investors to do portfolio analysis. It does not require a company’s cash flow or profit as inputs. This means that it can be used by companies with different cash flows and profit margins.
The BCG growth-share matrix can be used to identify and prioritize projects and evaluate the profitability of each product portfolio. It allows companies to understand how their strategic business units’ competitive advantage will impact future profit performance. It can also help them reduce costs, improve productivity, and increase value creation in the long run. Companies that are in the business of providing goods and services can use this tool to understand how they can improve their productivity, efficiency, and profitability.
How do you explain the BCG matrix?
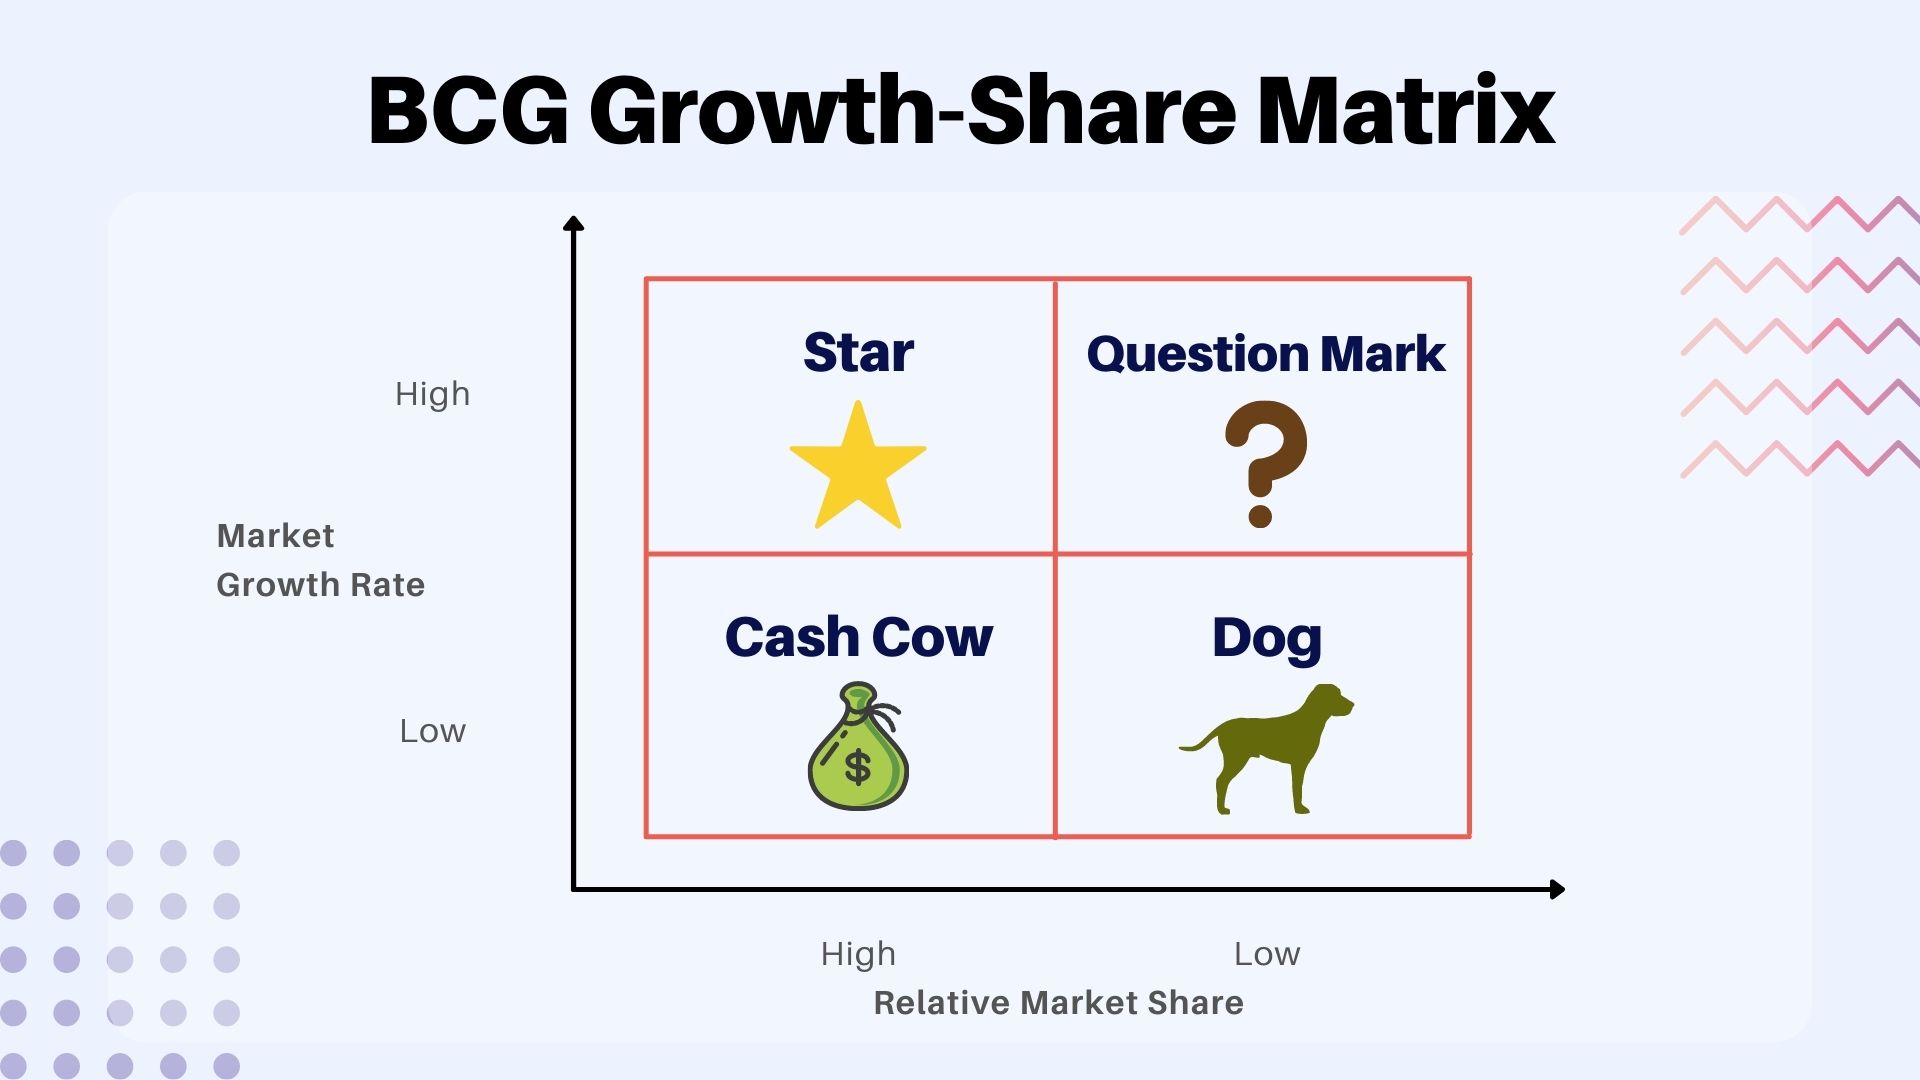
It is the best way to compare a company’s business units against each other, as opposed to comparing individual portfolio of products. It helps identify the most promising sectors for expansion or reduction in relative market share. The matrix consists of the market growth rate on the x-axis and relative market share on the y axis. The growth-share matrix defines four types/quadrants of SBUs:
Stars:
Stars are high growth, high share businesses or products. They need heavy investments to sustain their rapid growth. They will be the market leader of their industry or category. Over the period of time their phase of growth will slow down and they will turn into cash cows.
Cash Cows:
They are low growth, high market share businesses products. They are well established in their target market and require very little investment to hold their market share. They generate enough cash for the business to run and maintain other SBUs.
Dog:
Dogs are a low market growth rate, low market share businesses, and products. They may generate enough cash to maintain themselves but do not promise to be large sources of cash. They are usually killed off to maintain the profitability of other SBUs.
Question Marks:
Question marks are low share business units in high growth markets. They require a lot of cash to hold their share, let alone increase it. Management has to think hard about which questions it should try to build into stars and which should be phased out.
Strategies for each SBU
The company can pursue one of the four strategies for each SBU. The 4 strategies are Invest, Hold, Milk, and Divest.
For stars, you have to invest more to maintain their appetite for high growth and high market share maintenance. For cash cows, you have to invest less and expect the cash flow from the business to pay for its operation. For dogs, you can hold them or divest them as a means of maintaining the profitability of other SBUs. For question marks, there is no way out but a combination of investing in them and holding them.
Limitations of BCG Matrix
For one thing, it assumes that a company’s revenues are not influenced by other companies in the industry. For example, if a company has 30% of the market share in a particular industry, and all their competitors have 20%, then they will capture 60% of total profits from that industry. But if one competitor is acquired by another company, and their market share increases to 40%, then the company with 30% of the market share will capture only 60% of total profits from that industry. This limitation is not a problem for most companies, but it can become a problem if you are planning on entering an entirely new industry. The best way to avoid this problem is to find out as much information about the industry you are entering as possible, and then determine if there are any significant barriers to entry for your company in that industry.
The growth-share matrix also assumes that the firm’s revenues will remain constant over time. If a company’s revenues are growing at 5% per year, and its market share is also increasing by 5%, then the firm will capture an additional 10% of total profits from that industry. But if they grow their revenue at 3% per year, while decreasing their market share by 3%, then they will capture only 9% of total profits from that industry.
Conclusion
BCG Model is a useful tool for analyzing how profitable the industry is, and what the best strategy would be to pursue. However, it has limitations that make it less effective if you are planning on entering an entirely new industry or if your company’s revenues are growing at a different rate than its market share. Because of such problems, many companies have dropped matrix methods in favor of more customized approaches that better suit their specific situation.